A leak is when a application does not release references to a thread object properly. Due to this some Threads do not get garbage collected and the number of unused threads grow with time. Thread leak can often cause serious issues on a Java application since over a period of time too many threads will be created but not released and may cause applications to respond slow or hang.
In this article I am going to show how to perform a routine inspection of an application to find a thread leak. The first thing we will need is some sort of tool that could help us monitor the virtual machine of the running application. There is a very widely used tool, called VisualVm. It comes with the JDK but also can be downloaded separately in any OS.
Java visual vm is a profiling tool that comes with the jdk and can be used to monitor your running applications. But in order to be able to connect to your app using visualVm, you will have to include a few parameters to your start script.
java
-Dcom.sun.management.jmxremote
-Dcom.sun.management.jmxremote.port=8333
-Dcom.sun.management.jmxremote.local.only=false
-Dcom.sun.management.jmxremote.authenticate=false
-Dcom.sun.management.jmxremote.ssl=false
-jar myApp.jar
So if the app is configured and running, all you have to do is use visualVm to remotely connect to the correct host and port.
Once you connect to your application via visualVm, you can browse the diferent tabs and look for relevant information related to the VM and the threads. It will be very useful to also install a plugin for visual vm, called thread inspector which will allow you to examine in depth the running threads. You will be able to find the plugin in Tools>Plugins>Search for Thread Inspector
When there is a thread leak, often we will see an unusual large amounts one same type of thread visualVm's threads tab. If we double click in any of those threads, the plugin will show us more details about the class creating that thread.
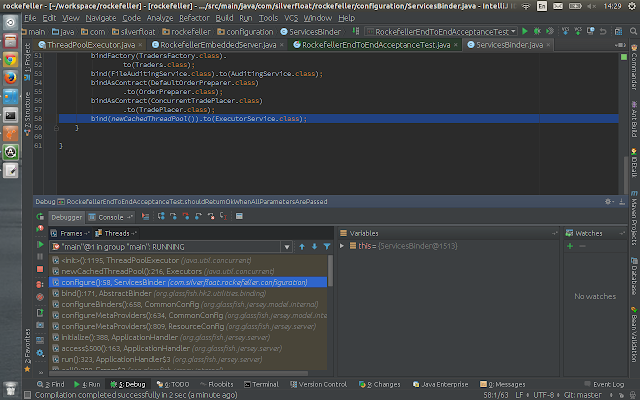
Go to your source codes and place a break point in the class constructor.
Now run your debugger in one of your acceptance tests and observe. The frames tab will highlight a bit brighter the methods in your source codes that are creating the thread.
Hopefully the debugger will help you pinpoint the cause of the issue so you can fix it.
In the given example, the cause of this leak was that a Jersey DI configured to create some instances of a pool per request and this was consuming the resources. The solution is either to make that injection Singleton or not do it at all if it is not needed(which hapen to be the case).
Finally, you could run visualVm again in your local running app to verify that there is no leakage before release. Running the acceptance test is probably not enough because you want to see if the leakage is there, so best is to run the app in a local or test environment.
For further reading and more detailed usage instructions see:
https://visualvm.java.net/gettingstarted.html


